In short
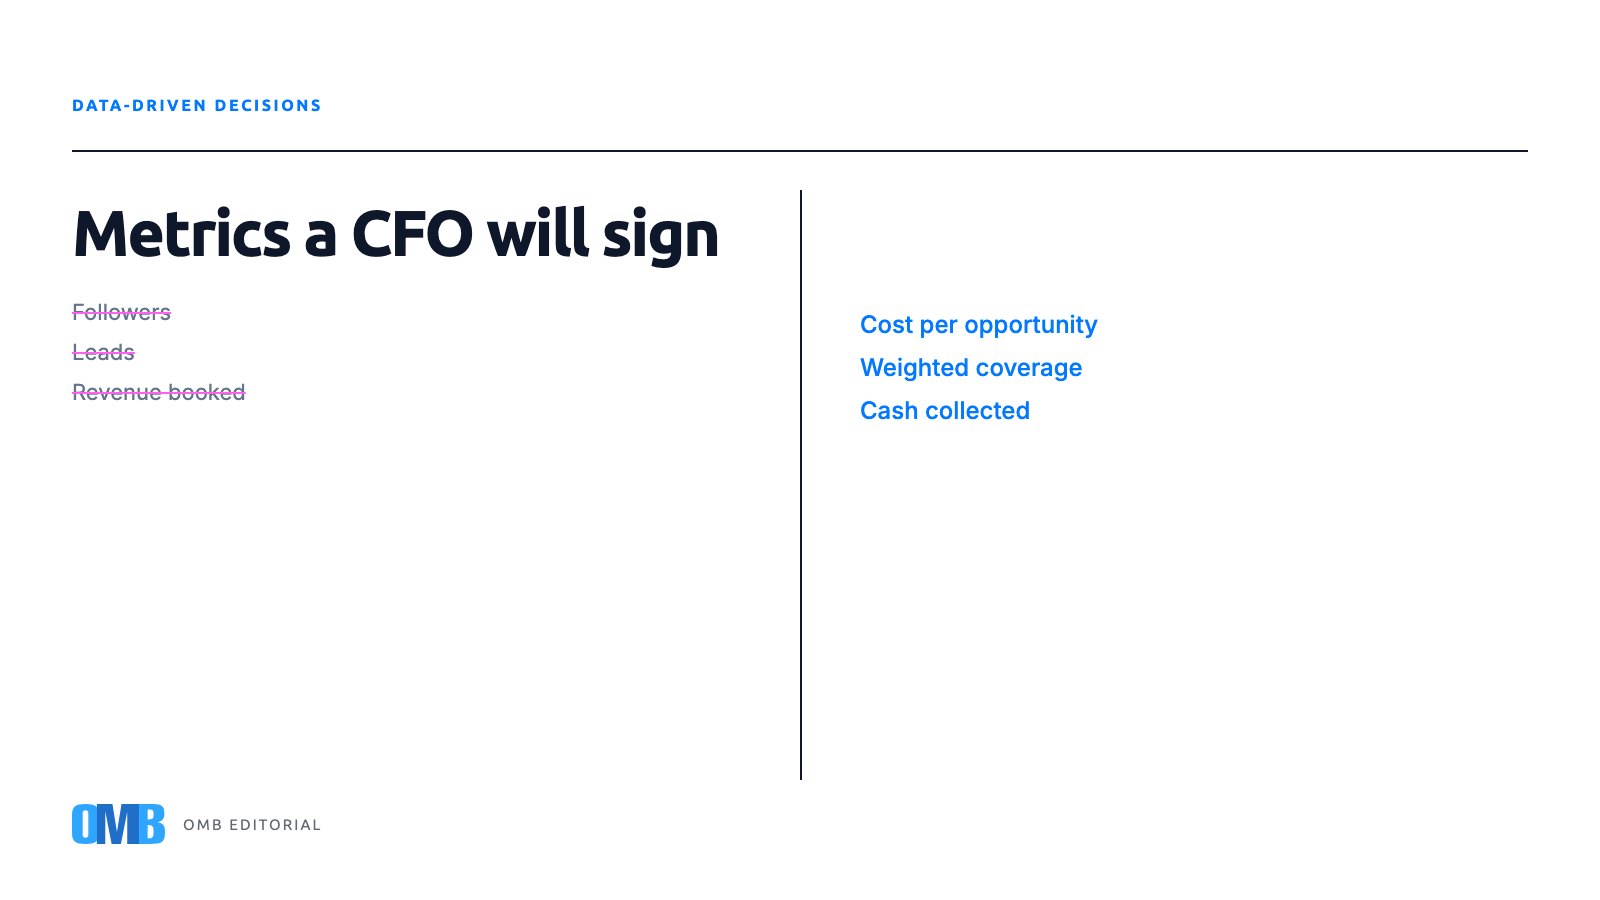
Vanity metrics describe attention: followers, sessions, leads, emails sent. Cash metrics describe money and time: cost per qualified opportunity, pipeline coverage, win rate, days to close, cash collected and margin per deal. A CFO signs off on the second group because each number can be traced to a bank balance or a forecast. Report the first group for context and run the business on the second.
Every February I sit in some version of the same meeting. Marketing brings a deck with growth in followers and sessions. Sales brings a pipeline that looks healthy from a distance. Finance brings a cash position that does not agree with either. The conversation goes better when everyone in the room understands the difference between a number that describes attention and a number that describes money.
Neither kind is dishonest. A vanity metric is simply a number that goes up without any obligation to bring cash with it. A cash metric is one that can be traced, line by line, to something that lands in the bank or shows up in the forecast. The first quarter is when the difference matters most, because the year's targets were set on the second kind and the first kind is what tends to get reported.
The table a CFO would actually sign
Below is the version of the table I use. The left column is what usually reaches the leadership meeting. The middle column is what I would replace it with. The right column is the question the replacement lets you answer.
| What gets reported | What the CFO signs off on | The question it answers |
|---|---|---|
| Followers and reach | Cost per qualified opportunity | What did it cost to create one real conversation with a buyer who fits? |
| Website sessions | Booked meetings per hundred inquiries | How much of the traffic turns into a calendar entry with a person in it? |
| Leads generated | Pipeline coverage weighted by stage | Is there enough qualified value, at its real probability, to hit the quarter? |
| Emails and calls made | Reply-to-meeting conversion | Of the people who answered, how many agreed to talk? |
| Proposals sent | Win rate and days to close | How often do we win, and how long is cash tied up waiting to find out? |
| Revenue booked | Cash collected and days sales outstanding | Has the money arrived, and how long does it take on average? |
| Discounts approved | Gross margin per deal | What did we keep after winning the price conversation? |
| Activities logged in the CRM | Forecast accuracy over three quarters | Can the number we commit to the board be trusted? |
Why the left column keeps winning the meeting
The left column is easier to produce. Followers are counted for you. Sessions arrive in a report every morning. Leads are whatever the form captured. None of it requires an agreement between departments about what a word means.
The middle column is harder because every entry depends on a definition that sales, marketing and finance have to share. What counts as qualified. When a meeting is booked rather than proposed. Which stage carries which probability. Until those definitions are written down and used by everyone, the cash column cannot be produced, and the vanity column fills the vacuum.
There is also a quieter reason. The left column almost always goes up. The middle column tells you when something went wrong, and it tells you in the first quarter, while there is still time to do something about it. That is uncomfortable, and it is the whole point.
How to move from one column to the other within a quarter
Start with the two rows that hurt most. For most mid-sized companies that is pipeline coverage and cash collected, because they decide whether the quarter closes and whether payroll is comfortable. Write the definition for each, agree on it in one meeting with the three department heads, and produce the number weekly, by hand if necessary, until the system can produce it for you.
Then attach a decision to each number. Coverage below the agreed multiple triggers a prospecting push in week two, not a conversation in week twelve. Days sales outstanding creeping up triggers a friendly collections check-in before the invoice ages into a problem. A metric that never changes a decision is a vanity metric, whichever column it sits in.
Keep the left column, by the way. Reach and sessions are useful early indicators of whether the message is landing. Move them to the appendix, and put the cash column on the first page where the board will read it.
A word on arithmetic, because it settles most arguments. If the quarter's target is a million in new revenue and the historical win rate is one deal in four, the qualified pipeline needs to hold roughly four million at the start of the quarter to be on plan. If the pipeline shows six million but half of it sits in the earliest stage, the weighted coverage is closer to two and a half, and the quarter is short before it begins. No follower count will tell you that, and no amount of activity logged in the CRM will fix it.
Key points
- Separate numbers that describe attention from numbers that describe money, and report them on different pages.
- Agree on written definitions for qualified, booked and stage probabilities before producing any cash metric.
- Start with pipeline coverage and cash collected, produced weekly, by hand if needed.
- Attach a specific decision to each cash metric so a bad reading triggers action in week two, not week twelve.
- Weight the pipeline by stage before you believe it covers the quarter.
Frequently asked questions
What is the difference between a vanity metric and a cash metric?
A vanity metric measures attention and can rise without bringing money with it: followers, sessions, leads captured, emails sent. A cash metric can be traced to the bank or to the forecast: cost per qualified opportunity, weighted pipeline coverage, win rate, days to close, cash collected, margin per deal. Report the first kind for context and run the business on the second.
How much pipeline coverage does a company need to hit its quarterly target?
Enough that, at the historical win rate, the qualified pipeline covers the target. If one deal in four closes, the pipeline should hold about four times the target at the start of the quarter. Weight each deal by its stage before you believe the total, because early-stage value inflates the multiple and hides a shortfall until it is too late to fix.
Which sales and marketing metrics should be reported to the board?
The ones that can be traced to money and time: cost per qualified opportunity, booked meetings per hundred inquiries, stage-weighted pipeline coverage, win rate, days to close, cash collected, days sales outstanding, gross margin per deal and forecast accuracy. Put reach and sessions in an appendix as early indicators. Every number on the first page should have a decision attached.
If you would like help turning your current reporting into the second column, a thirty-minute conversation with us is a practical place to start.
About the author
 Romina AbreuFinanceOMB Editorial Team
 Part of the OMB Cloud AES agent team, writing from what they see every day operating businesses.