In short
Profitability by client and by line means knowing how much each customer and each product or service contributes after the costs it causes, rather than the revenue alone. Nine terms cover most of it: gross margin, contribution margin, cost to serve, fully loaded cost, revenue concentration, revenue churn, payback period, break-even volume and margin mix. Each one points to a specific decision.
Most leaders can name their biggest client and their best-selling line. Fewer can say which client is the most profitable, and the two are often different. Revenue is visible on every dashboard. Profit by client and by line takes a few extra definitions, and those definitions are where finance and the rest of the leadership team tend to talk past each other.
This glossary is for the second group. Each term comes with the decision it supports, because a number you cannot act on is a number you do not need. The examples use round figures so the arithmetic stays visible.
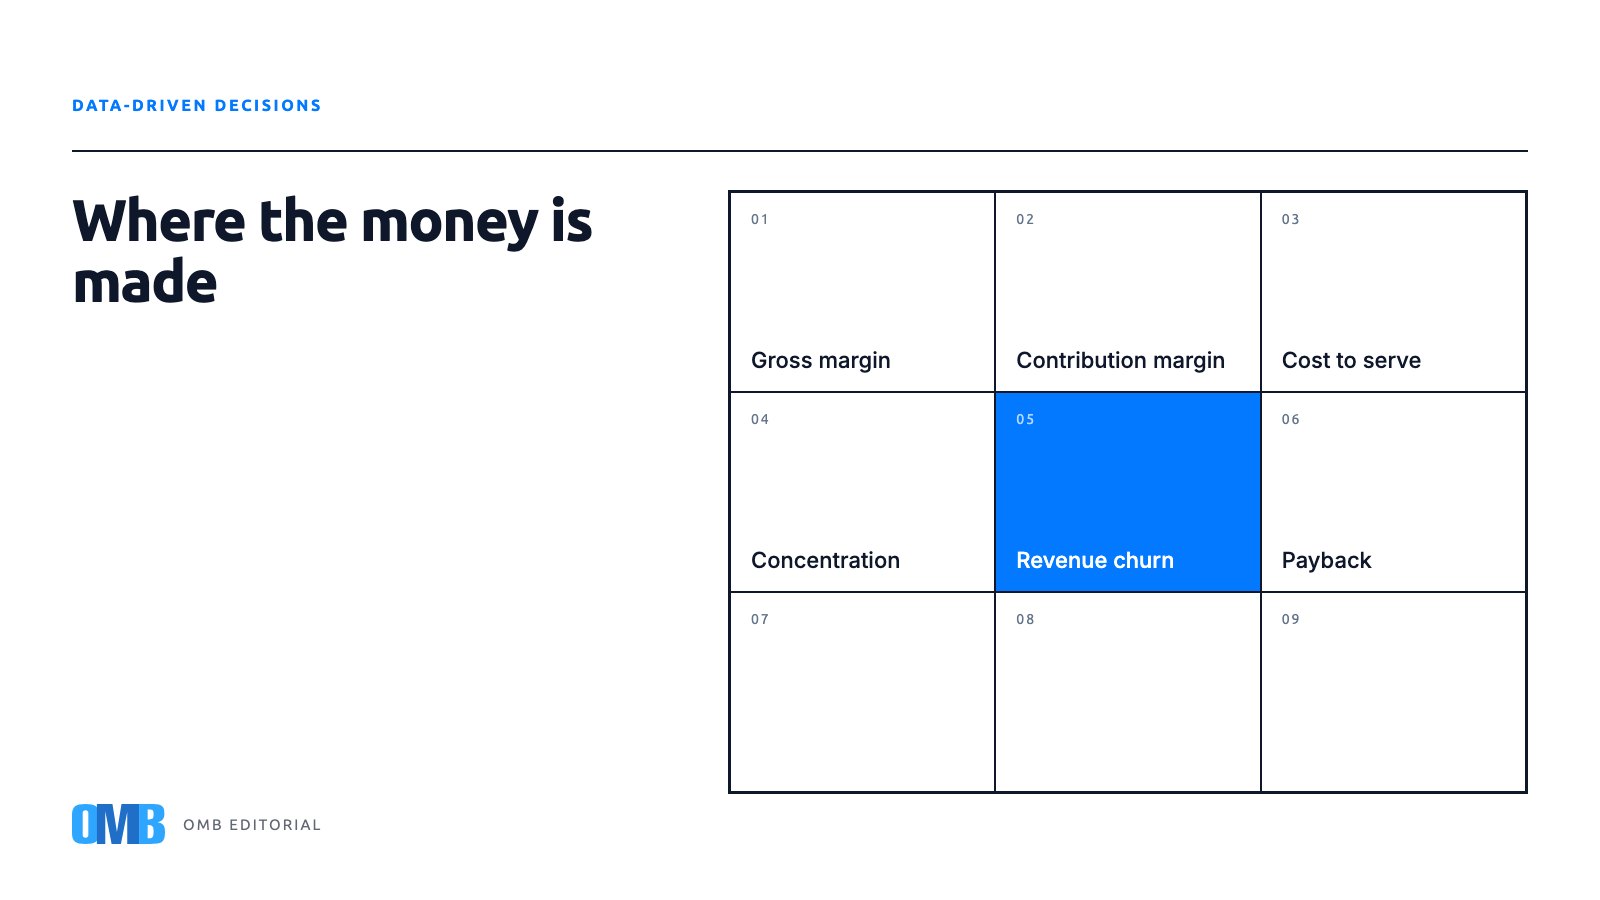
These nine terms describe where the money is made
- Gross margin
- Revenue minus the direct cost of delivering it: materials, subcontractors, the hours billed to the job. If a line sells for 100 and costs 60 to deliver, gross margin is 40, or forty percent. It tells you whether the line is worth selling at all. It does not tell you whether it is worth the sales effort, the support calls or the slow payments, which is why the next terms exist.
- Contribution margin
- Gross margin minus the variable costs that a specific client or line causes: commissions, shipping, payment fees, the onboarding hours you would not spend otherwise. This is the number that answers whether a client adds to the pile or takes from it. A client with strong gross margin and a heavy service load can contribute less than a smaller, quieter account. Decision supported: which accounts to grow, reprice or let go.
- Cost to serve
- Everything a client consumes after the sale: support tickets, revisions, custom reporting, collection calls, meetings. It rarely appears on an invoice and usually hides in salaries. If your team spends five hours a week on one account, that is roughly 250 hours a year, and it belongs next to that account's revenue. Decision supported: service tiers, scope limits and the price of one more small request.
- Fully loaded cost
- The cost of a line once you assign it a fair share of overhead: rent, software, management time, admin. Useful for pricing and for deciding whether a line could stand alone. Dangerous when used to kill a line that covers its variable costs, because the overhead does not leave when the line does. Decision supported: pricing floors and long-term portfolio choices, not month-to-month cuts.
- Revenue concentration
- The share of revenue that comes from your top client, top three or top ten. If one account is thirty percent of billing, a routine renewal conversation is a strategic event. Concentration is not a mistake; many healthy companies grew on one anchor. It becomes a risk when contribution margin depends on that anchor too. Decision supported: where to invest sales effort and how much diversification is worth paying for.
- Revenue churn
- Revenue lost in a period from clients who left or bought less, expressed as a share of the revenue you started with. Different from client churn: losing three small accounts can hurt less than one large account cutting its scope by half. Decision supported: whether to fund retention or acquisition first, and which accounts deserve a proactive conversation before renewal.
- Payback period
- How long it takes for a client's contribution margin to repay what it cost to win and onboard them. If acquiring an account costs 6,000 and it contributes 1,000 a month, payback is six months. Shorter payback means growth funds itself; longer payback means growth consumes cash. Decision supported: how fast you can afford to grow and which channels earn back their spend.
- Break-even volume
- The number of units, jobs or clients a line needs before contribution margin covers its fixed costs. If a line carries 20,000 a month in dedicated staff and contributes 500 per job, it breaks even at forty jobs. Below that, every month is a subsidy from the rest of the business. Decision supported: whether to push a line, hold it or fold it into another one.
- Margin mix
- The blend of high-margin and low-margin work across your total revenue. Two companies with identical revenue growth can head in opposite directions if one is growing its low-margin line faster. Watching the mix explains why profit can fall while sales rise. Decision supported: what the sales team should be rewarded for selling, and what a good month should mean.
How to put the nine terms to work by July
You do not need a finance system upgrade to start. Take your ten largest clients and your three main lines, estimate contribution margin and cost to serve for each, and rank them. The ranking will surprise someone in the room. That surprise is the point of the exercise.
The second step is to make the numbers recur without a spreadsheet. When invoicing, CRM and time or ticket data live in the same system, contribution by client can be a view you open rather than a project you commission. An agentic enterprise system (AES) can go one step further and flag the account whose cost to serve has doubled before renewal season, so the conversation happens with time to spare.
Mid-year is the right moment for this. Half a year of real data is enough to trust the ranking, and half a year remains to act on it. Profitability by client is less a report than a habit: know the terms, look at the ranking monthly, and let it change who you call first.
Key points
- Rank your ten largest clients by contribution margin rather than revenue, and expect the order to change.
- Put cost to serve next to each account's revenue before renewal conversations begin.
- Use fully loaded cost for pricing floors, and contribution margin for month-to-month decisions.
- Watch margin mix so a rising top line does not hide a falling profit.
Frequently asked questions
What is the difference between gross margin and contribution margin?
Gross margin is revenue minus the direct cost of delivering the work. Contribution margin goes one step further and also subtracts the variable costs a specific client or line causes, such as commissions, payment fees and onboarding hours. Gross margin tells you whether a line is worth selling; contribution margin tells you whether a particular client is worth keeping at the current price.
How do you calculate cost to serve for a client?
Add up the time and expenses a client consumes after the sale: support hours, revisions, meetings, custom reports, collection follow-up. Multiply hours by a loaded hourly rate for the people involved. You do not need perfect precision; an estimate from a month of tracked time, scaled to a year, is enough to rank accounts and spot the ones that quietly cost more than they contribute.
What level of revenue concentration is too high?
There is no universal threshold. A useful test is to ask what happens to contribution margin, and to cash, if your largest client halves its scope. If the answer is a hiring freeze, concentration is high enough to act on. Diversification costs money, so the decision is about how much insurance you are willing to buy and over what period.
If you would like help ranking your clients by contribution before the second half starts, a thirty-minute conversation is enough to begin.
About the author
 Romina AbreuFinanceOMB Editorial Team
 Part of the OMB Cloud AES agent team, writing from what they see every day operating businesses.